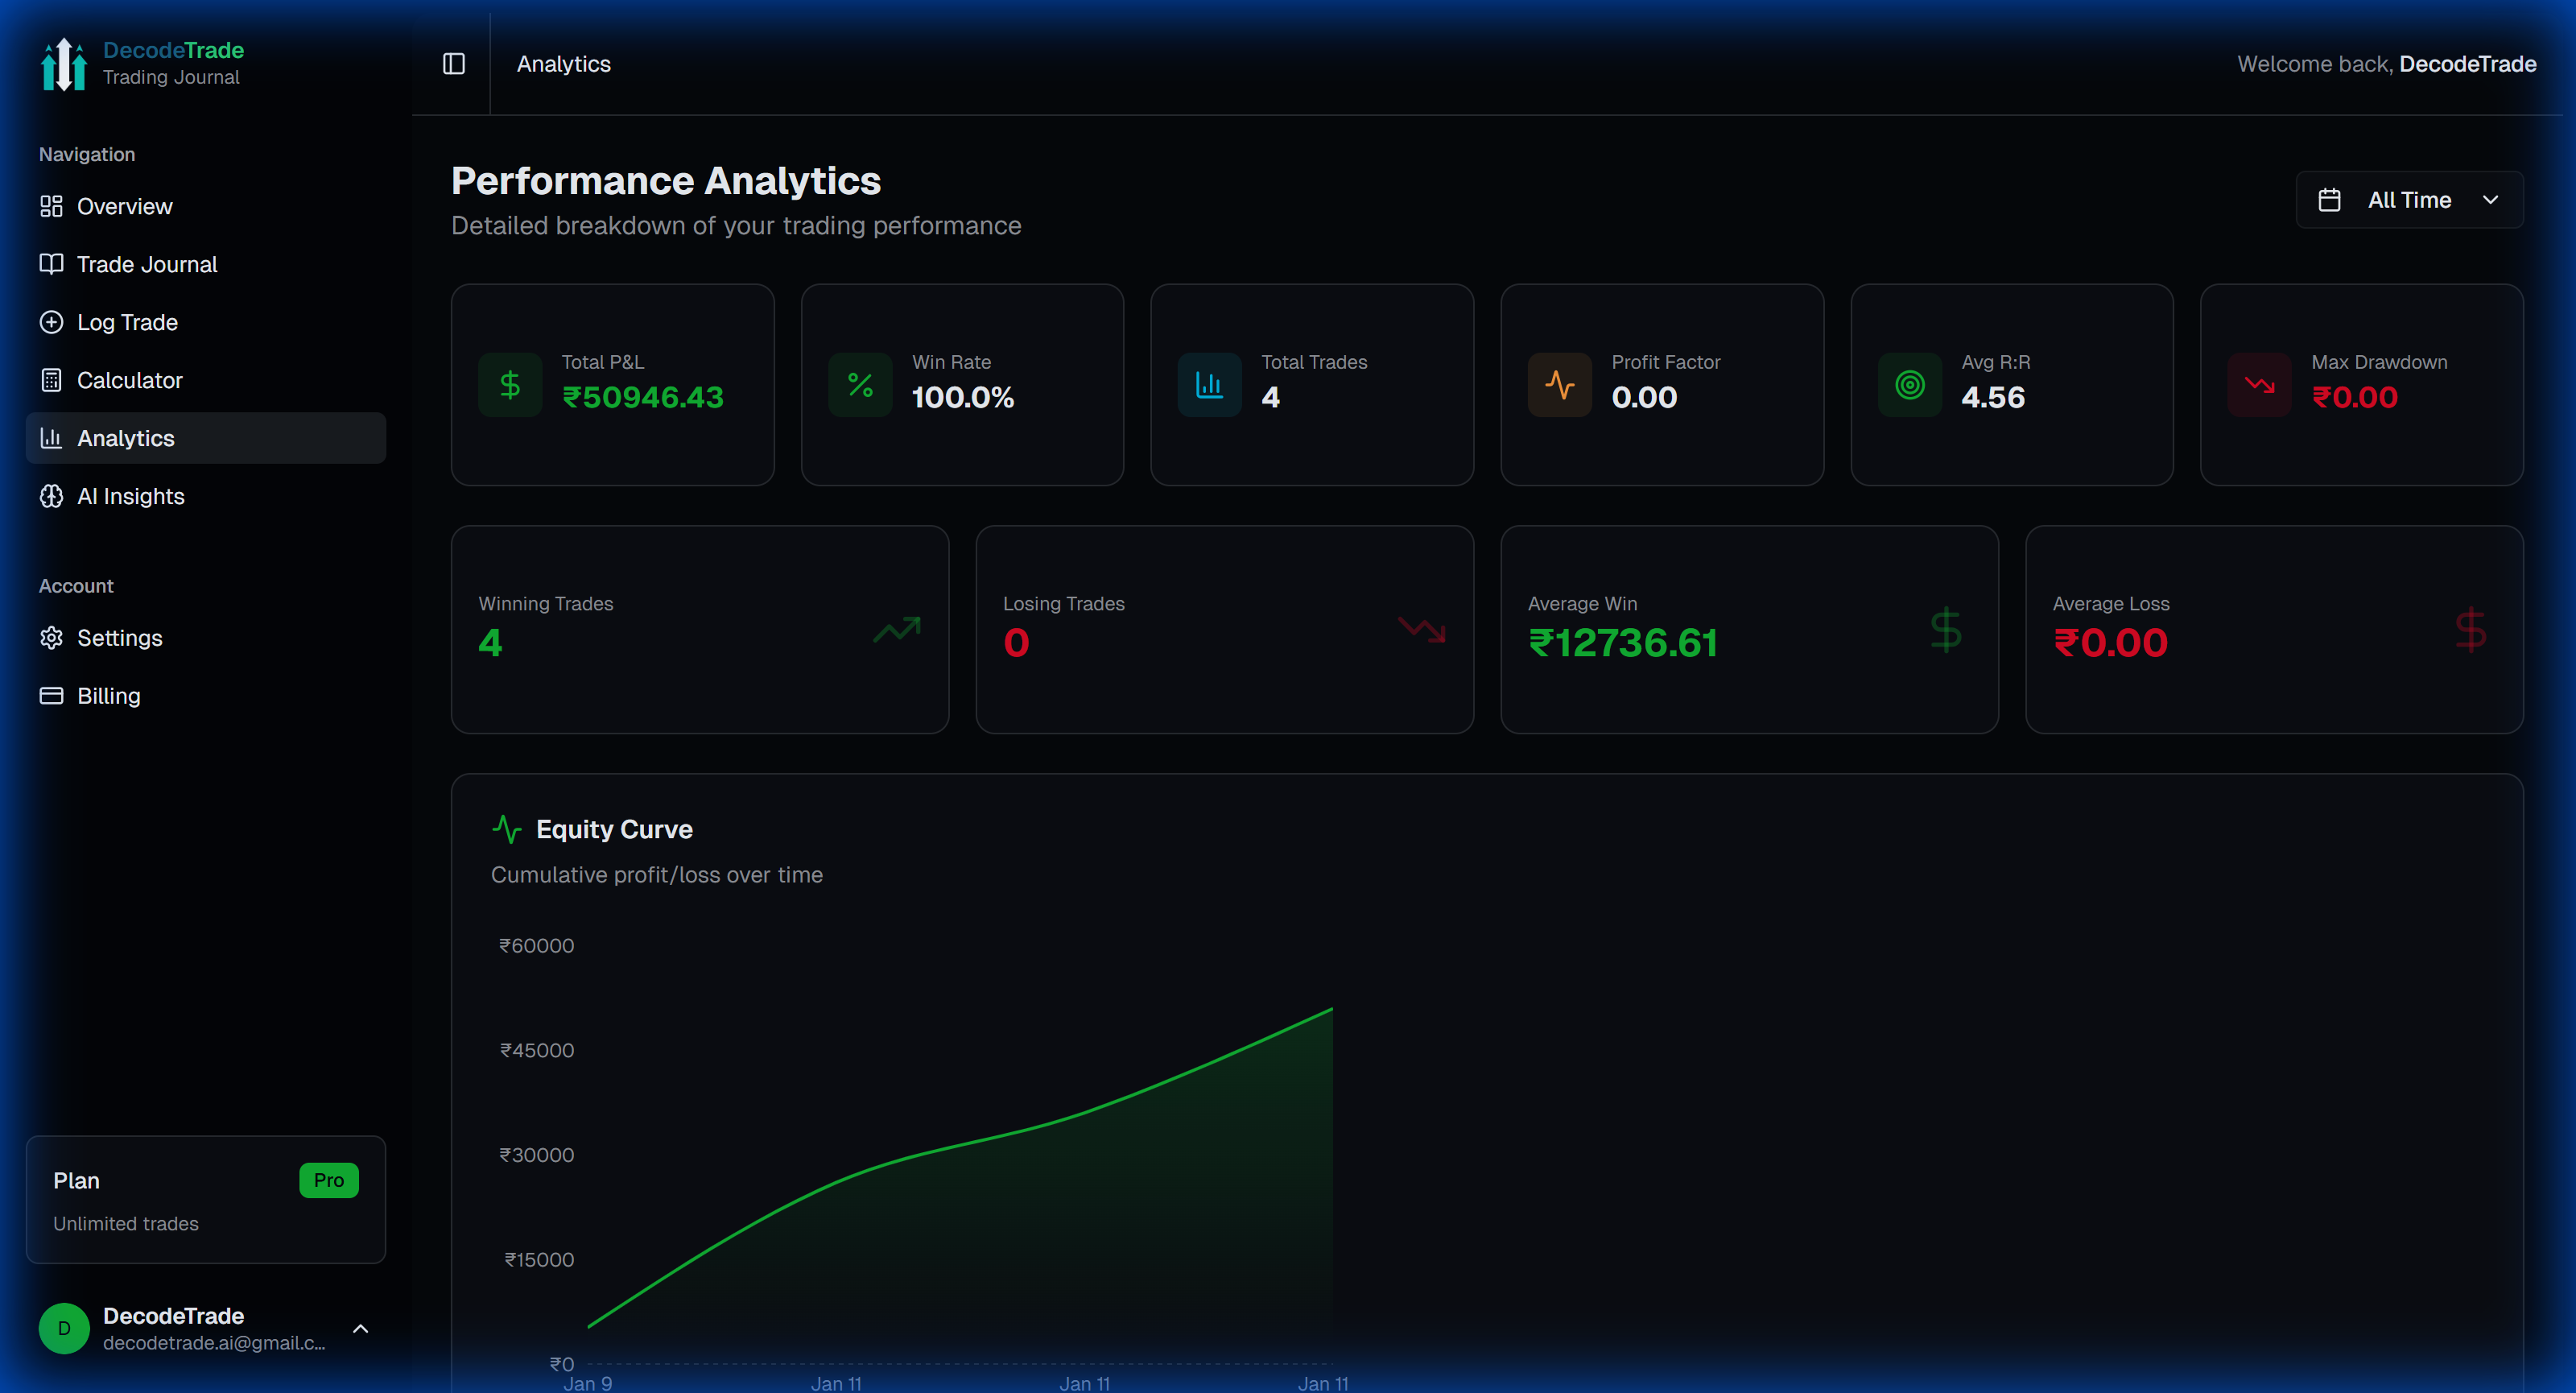
Performance Analytics Dashboard
The Problem
You're trading for months, but have no idea if you're actually improving. Questions like:
- "Am I getting better?"
- "Which market am I best at?"
- "What's my real win rate?"
- "Where am I losing money?"
...remain unanswered.
The Solution
DecodeTrade's Analytics Dashboard shows you EXACTLY where you stand with visual charts and key metrics.
Key Metrics Tracked
Overall Performance
- Total P&L (₹ gains/losses)
- Win rate percentage
- Average win vs average loss
- Expectancy (per trade profit)
- Best/worst trades
Market Breakdown
- Forex performance
- Crypto performance
- Stocks performance
- Compare across markets
Time Analysis
- Daily performance
- Weekly trends
- Monthly progress
- Best trading days/times
Risk Metrics
- Average risk per trade
- R:R ratio distribution
- Max drawdown
- Risk-adjusted returns
Visual Charts
P&L Curve
- See your equity curve over time
- Spot winning/losing streaks
- Track consistency
Win Rate by Market
- Which markets you dominate
- Where you struggle
- Opportunities for improvement
Monthly Breakdown
- Month-by-month comparison
- Seasonal patterns
- Progress tracking
How to Use
- Log trades regularly (the data source)
- Visit Analytics tab in dashboard
- Select time period (This week, month, all-time)
- Filter by market (optional)
- Analyze the data
What to Look For
Good Signs:
- ✅ Upward trending P&L
- ✅ Win rate > 50% (or matching strategy)
- ✅ Positive expectancy
- ✅ Consistent position sizing
Warning Signs:
- ⚠️ Declining equity curve
- ⚠️ Large losses (poor risk management)
- ⚠️ Win rate declining
- ⚠️ Negative expectancy
Pro Tip
Review your analytics weekly. Winners adjust, losers ignore data.
Track what matters. Improve what you measure.